MLBrandow wrote:LSAT Blog,
What might a score breakdown by date look like? What I mean is, what is the spread of applicants who haven't applied yet likely to look like?
Might it hold true that a higher proportion of higher scorers have already applied, whereas perhaps a lower proportion of lower scorers have not?
Would it be possible to create a chart including a spread of 5 point LSAT ranges and number of applications by date?
I would be very interested to see where most 170+ scorers are applying, or whether it is bimodal, or even if there is no statistically significant correlation at all.
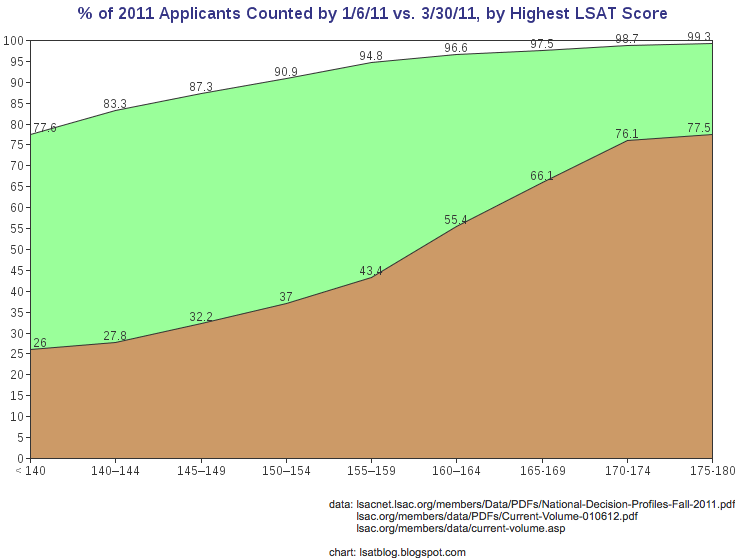
Great questions, MLBrandow. As one would expect, it is the case that a greater % of high scorers have already applied. I mentioned this briefly at the top of this page but wanted to give a fuller picture.
Below is a graph depicting the breakdown for all score ranges. It's based on LSAC's (presumed) applicant count by 1/6/11 and 3/30/11 (based upon LSAC's reports for 1/6/12 and 3/30/12), as % of total applicant count for the 2010-11 cycle:
(I assume folks are more interested in applicant count than application count, and I assume you mean *when* most 170+ scorers are applying as opposed to *where.* We already have a pretty good idea of where, don't we?)
1/6/12 is the first date that LSAC included breakdowns by score range, so it's the one I chose to analyze. I used the information provided in that report to determine LSAC's count of 2011 applicants by 1/6/11. Next cycle, we'll presumably have more information about what happens over the course of a cycle.