Page 1 of 1
Question from someone with somewhat shaky math skills
Posted: Thu Nov 07, 2013 12:55 am
by neprep
So the LSAT score comes with a score band of 7 scaled points, created by subtracting and adding 3 points to the reported score to form the lower and upper bounds of the band respectively.
LSAC claims that this score band contains a test taker's "actual proficiency level" 68% of the time, where I'm guessing "actual proficiency level" is equivalent to what LSAC has in other publications called the "true score."
My question is this: From this information, can we derive the probability of the reported score's being equal to the "actual proficiency level" for a test taker? If a band of 7 points has a 68% chance of containing the true score, is the probability of the reported score's being your true score = 68/7 = 9.7%? Or if it is not the case that each score point within the band has the same probability of being the scaled score, what's a good bet for how that probability is distributed within the band?
Re: Question from someone with somewhat shaky math skills
Posted: Thu Nov 07, 2013 12:59 am
by 062914123
.
Re: Question from someone with somewhat shaky math skills
Posted: Thu Nov 07, 2013 1:02 am
by RhymesLikeDimes
No, I don't think you can assume an equal probability for all 7 values within that range.
Re: Question from someone with somewhat shaky math skills
Posted: Thu Nov 07, 2013 1:03 am
by neprep
bee wrote:ffs you're done with the lsat, are you thinking about this... for fun?!
nerd.
<3
What can I say…this test is a gift that just keeps on giving.
Re: Question from someone with somewhat shaky math skills
Posted: Thu Nov 07, 2013 1:04 am
by mindarmed
neprep wrote:So the LSAT score comes with a score band of 7 scaled points, created by subtracting and adding 3 points to the reported score to form the lower and upper bounds of the band respectively.
LSAC claims that this score band contains a test taker's "actual proficiency level" 68% of the time, where I'm guessing "actual proficiency level" is equivalent to what LSAC has in other publications called the "true score."
My question is this: From this information, can we derive the probability of the reported score's being equal to the "actual proficiency level" for a test taker? If a band of 7 points has a 68% chance of containing the true score, is the probability of the reported score's being your true score = 68/7 = 9.7%? Or is it not the case that each score point within the band has the same probability of being the scaled score?
it would be extremely difficult to determine the subjective probability of each outcome.
Re: Question from someone with somewhat shaky math skills
Posted: Thu Nov 07, 2013 1:34 am
by MKC
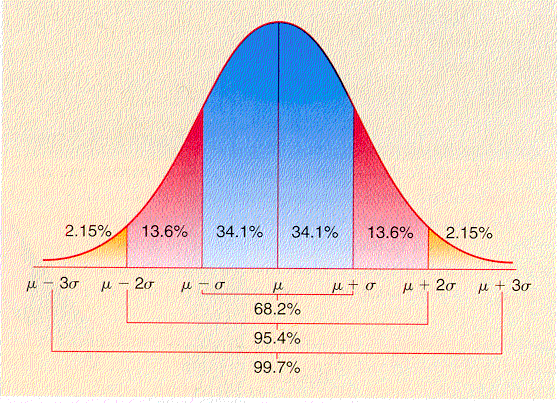
Normal distribution. The number in the middle is the highest probability outcome. + or - 3 covers 1 standard deviation, which encompasses 68% of probable outcomes.
Re: Question from someone with somewhat shaky math skills
Posted: Thu Nov 07, 2013 2:09 am
by aboutmydaylight
neprep wrote:So the LSAT score comes with a score band of 7 scaled points, created by subtracting and adding 3 points to the reported score to form the lower and upper bounds of the band respectively.
LSAC claims that this score band contains a test taker's "actual proficiency level" 68% of the time, where I'm guessing "actual proficiency level" is equivalent to what LSAC has in other publications called the "true score."
My question is this: From this information, can we derive the probability of the reported score's being equal to the "actual proficiency level" for a test taker? If a band of 7 points has a 68% chance of containing the true score, is the probability of the reported score's being your true score = 68/7 = 9.7%? Or if is it not the case that each score point within the band has the same probability of being the scaled score, what's a good bet for how that probability is distributed within the band?
You can kind of sort of estimate it. It isn't as simple as dividing by 7 because the normal distribution is not uniform.
LSAC is saying the standard deviation of test scores around the true test score is 3. So if you get a 165, LSAC is saying that based on that test score alone, your true score will be between 162 and 168 68% of the time. So what we need to do is figure out what % of the time will your true score be 165? Since the data is discrete, you can figure out what % of the data falls between 164.5 and 165.5 with a mean 165 and SD 3. (165.5-165)/3 = .166666. Looking at a z table, the answer is roughly 12.72%.
Maybe a better estimate would be to assume LSAC's standard deviation is 3.5 (68% of the data would fall between 161.5 and 168.5). In this case the answer is roughly 11.14%.
This doesn't really mean anything though, since those are just assumptions LSAC makes about someone's true test score, and presumably every individual would have a different SD, and the true mean isn't measurable.
Re: Question from someone with somewhat shaky math skills
Posted: Thu Nov 07, 2013 9:42 am
by neprep
MarkinKansasCity wrote:
Normal distribution. The number in the middle is the highest probability outcome.
+ or - 3 covers 1 standard deviation, which encompasses 68% of probable outcomes.
aboutmydaylight wrote:
You can kind of sort of estimate it. It isn't as simple as dividing by 7 because the normal distribution is not uniform.
LSAC is saying the standard deviation of test scores around the true test score is 3. So if you get a 165, LSAC is saying that based on that test score alone, your true score will be between 162 and 168 68% of the time. So what we need to do is figure out what % of the time will your true score be 165? Since the data is discrete, you can figure out what % of the data falls between 164.5 and 165.5 with a mean 165 and SD 3. (165.5-165)/3 = .166666. Looking at a z table, the answer is roughly 12.72%.
Maybe a better estimate would be to assume LSAC's standard deviation is 3.5 (68% of the data would fall between 161.5 and 168.5). In this case the answer is roughly 11.14%.
This doesn't really mean anything though, since those are just assumptions LSAC makes about someone's true test score, and presumably every individual would have a different SD, and the true mean isn't measurable.
Oooh, fascinating. So even within the band there's a normal distribution. Even if 11-12% are just a guesstimates, it's still surprisingly low, but I suppose it's just surprising because it's the first time I've ever thought about it.
Thanks for helping out the statistics nube, folks!
Re: Question from someone with somewhat shaky math skills
Posted: Thu Nov 07, 2013 12:29 pm
by koalacity
bee wrote:ffs you're done with the lsat, are you thinking about this... for fun?!
Also, I comprehended about 50% of this post at best. Did I mention that my SAT math score was (apparently) in the 56th percentile?
Re: Question from someone with somewhat shaky math skills
Posted: Thu Nov 07, 2013 1:08 pm
by ScottRiqui
Mark pretty much nailed it, except that 68% actually covers *two* standard deviations, since it encompasses the range from "median minus one SD" to "median plus one SD".
Re: Question from someone with somewhat shaky math skills
Posted: Thu Nov 07, 2013 1:57 pm
by neprep
koalacity wrote:bee wrote:ffs you're done with the lsat, are you thinking about this... for fun?!
Also, I comprehended about 50% of this post at best. Did I mention that my SAT math score was (apparently) in the 56th percentile?
Did you mention that on the LSAT your score was (apparently) in the 99.9th percentile?
